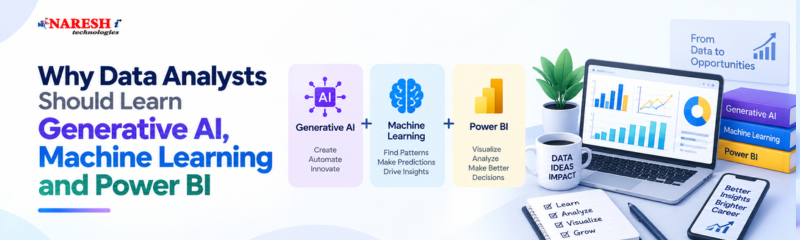
A data analyst I know spent three days last month building a churn report in Power BI. Clean visuals, solid DAX measures, the works. Her manager looked at it and asked, "Can you tell me which customers are likely to churn next month, not just who churned last month?" That question moved the task from reporting to prediction, and Power BI alone couldn't answer it.
This is happening across teams right now. The line between "data analyst" and "data scientist" is blurring, not because job titles changed overnight, but because the tools available to analysts changed. Generative AI can summarize a dataset in plain English. Machine learning can forecast what a dashboard alone never could. Power BI, the tool most analysts already know, is quietly absorbing both.
If you're wondering whether you need to learn AI and ML to stay relevant, the honest answer is: not to survive, but to grow. Here's what that looks like in practice.
A data analyst's job used to be fairly contained: pull data, clean it, build a dashboard, explain the numbers. That's still true, but the questions have shifted. "What happened last quarter" is now often followed by "what's likely to happen next quarter" or "can the dashboard just tell me why."
The first is a forecasting problem, which needs machine learning. The second is closer to a summarization problem, where generative AI has become genuinely useful. Analysts who can only answer "what happened" are increasingly working alongside analysts who can also answer "what's coming."
Power BI is excellent at what it was built for: turning structured data into visual, explorable reports. But it was never designed to predict outcomes on its own. Even its built-in AI visuals, Key Influencers, Decomposition Tree, Q&A, work off patterns already present in historical data. They can tell you which factors were associated with past churn. They cannot build and validate a model that estimates the probability of a specific customer churning next month.
That requires an actual machine learning model feeding a prediction column into the dashboard, the same way any other field gets fed in. A BI tool and a predictive model solve different problems, and a competent analyst needs to know which one to reach for.

Generative AI earns its place in a few specific spots: summarizing what changed in a metric instead of writing narrative from scratch, drafting and debugging SQL or DAX, speeding up exploratory analysis by suggesting what's worth investigating, and writing first-draft documentation. What it doesn't reliably do is guarantee accuracy. It can produce a plausible but wrong explanation for a trend if nobody checks it against the actual data, so treat it as a drafting assistant, not a source of truth.
Machine learning earns its place when the question moves from description to prediction: churn probability, demand forecasting, anomaly detection, segmentation. An analyst doesn't need to become an ML engineer to use this. Preparing a clean, labeled dataset, understanding basic evaluation metrics like precision and recall, and knowing how to interpret a model's output are usually enough to work alongside a Data Science team or build simple models independently with a tool like scikit-learn.
Where it doesn't fit: building a model for a question the business isn't actually going to act on. A churn model is only useful if there's a retention workflow ready to use it.
What would the next version of that churn dashboard actually look like? The analyst pulls historical data (tenure, usage, support tickets, plan type) and trains a simple classifier to predict churn probability:
python
import pandas as pd
from sklearn.model_selection import train_test_split
from sklearn.linear_model import LogisticRegression

df = pd.read_csv("customer_data.csv")
df = pd.get_dummies(df, columns=["plan_type"], drop_first=True)

features = df.drop(columns=["churned", "customer_id"])
target = df["churned"]

X_train, X_test, y_train, y_test = train_test_split(
    features, target, test_size=0.2, random_state=42
)

model = LogisticRegression(max_iter=1000)
model.fit(X_train, y_train)

df["risk_score"] = model.predict_proba(features)[:, 1]
df[["customer_id", "risk_score"]].to_csv("churn_scores.csv", index=False)
This isn't production-grade, there's no cross-validation here, but it shows the mechanics: encode categorical fields, split the data, fit a model, generate a probability instead of a yes/no label. That output becomes a new column Power BI can plug into like any other field. A generative AI layer can then auto-generate a short explanation next to high-risk accounts, turning a number into something a customer success manager can act on. Power BI for visualization, ML for prediction, generative AI for explanation, none of the three replaces the others.
Once that risk score exists, the instinct is often to show it as a pie chart. In practice, bar charts usually read better. Pie charts work fine with two or three clearly different slices; once categories are close in size, comparing angles gets harder than comparing bar heights. A breakdown like 620 low-risk, 340 medium-risk, and 140 high-risk customers is easier to scan as three bars than as similarly shaded wedges. Inside Power BI, save pie charts for genuinely simple two- or three-slice splits, and default to bars or columns for anything a stakeholder needs to compare at a glance.
|
S.No |
Aspect |
Traditional Analytics |
AI-Augmented Analytics |
|
1 |
Core question |
What happened? |
What's likely to happen next? |
|
2 |
Primary tool |
Power BI, Excel, SQL |
Power BI plus ML models and GenAI |
|
3 |
Output |
Static reports, dashboards |
Dashboards with predictions and summaries |
|
4 |
Skill emphasis |
Data cleaning, DAX, visualization |
Same, plus model literacy and Python |
|
5 |
Analyst's role |
Report and explain |
Report, predict, and recommend |
Traditional analytics skills remain the foundation; AI simply extends what an analyst can offer once that foundation is solid.
SQL and business context still sit at the top. AI and ML extend an analyst's range; they don't replace the fundamentals.

Treating a generative AI summary as verified fact is the most frequent mistake. If a model claims "sales dropped due to seasonality" without anyone checking that against the sales calendar, a wrong conclusion can land in a leadership deck.
Building a model without understanding its limits is the second. A model trained during a normal sales cycle won't necessarily hold during a supply disruption or a new competitor's entry, and a rushed model with no train-test split can look accurate on paper while it's just memorizing its training data.
The third is skipping data quality work because AI feels like it can compensate for messy data. It can't. A model or summary built on inconsistent data produces confident, wrong answers faster than a person would.
Start with SQL and Power BI fundamentals until you're comfortable building a clean report from raw data. Add statistics next, since it underpins everything after it. Move into Python basics for data manipulation, then a first pass at machine learning: classification, regression, evaluation metrics, using something close to the churn example as practice. Pick up generative AI tools in parallel, since that learning curve is shorter and more about workflow habits than depth. Don't skip steps: a model built on a shaky SQL foundation tends to fail exactly when it matters most.
Some Python helps, particularly pandas and scikit-learn. You don't need to become a software engineer, many analysts start with Power BI's built-in AI visuals and move to Python only when a project needs custom modeling.
It removes repetitive parts of the job, like drafting summaries or boilerplate SQL, rather than replacing judgment. Understanding business context and validating findings still needs a person.
Yes. AI-generated insights still need a place stakeholders can explore and trust, and Power BI remains one of the most widely used tools for that.
Data scientists typically build and productionize more complex models with formal validation and deployment. Analysts who add ML and AI skills tend to apply simpler, well-understood models to specific business questions while still owning reporting.
A churn prediction layered onto an existing Power BI dashboard, like the example above, combines a real business question, a manageable modeling problem, and a visualization you likely already know how to build.
The shift here isn't about chasing every new AI feature. It's that Power BI, machine learning, generative AI, and even choosing the right chart type solve different parts of the same problem: understanding data, predicting what's next, and explaining it clearly. An analyst who can move between all of these is simply more useful on a modern data team.

If you're evaluating a Data Analytics course, look for one that treats AI and ML as extensions of core analyst skills, not a separate track. The fundamentals still come first.
What's one dashboard on your team right now that's still purely descriptive but could use a predictive layer?
Follow NareshIT for more practical insights on technology, skills, and career development.
 +91 8179191999

 +91
8179191999
+91
8179191999